Using Dashboard To Access Kubernetes Cluster Post Deployment On 3Engines Cloud 3Engines Magnum🔗
After the Kubernetes cluster has been created, you can access it through command line tool, kubectl, or you can access it through a visual interface, called the Kubernetes dashboard. Dashboard is a GUI interface to Kubernetes cluster, much the same as kubectl as a CLI interface to the Kubernetes cluster.
This article shows how to install Kubernetes dashboard.
What We Are Going To Cover🔗
- Deploying the dashboard
- Creating a sample user
- Creating secret for admin-user
- Getting the bearer token for authentication to dashboard
- Creating a separate terminal window for proxy access
- Running the dashboard in browser
Prerequisites🔗
No. 1 Hosting
You need a 3Engines Cloud hosting account with Horizon interface https://3engine.rootxwire.com/.
No. 2 Cluster and kubectl should be already operational
To eventually set up a cluster and connect it to the kubectl tool, see this article How To Access Kubernetes Cluster Post Deployment Using Kubectl On 3Engines Cloud 3Engines Magnum.
The important intermediary result of that article is a command like this:
Note the exact command which in your case sets up the value of KUBECONFIG variable as you will need it to start a new terminal window from which the dashboard will run.
Step 1 Deploying the Dashboard🔗
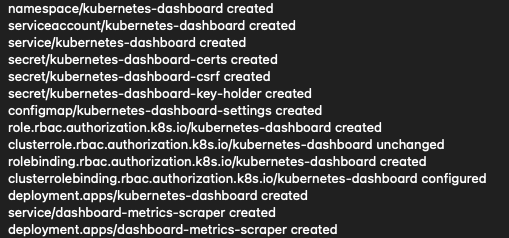
Install it with the following command:
kubectl apply -f https://raw.githubusercontent.com/kubernetes/dashboard/v2.4.0/aio/deploy/recommended.yaml
The result is
Step 2 Creating a sample user🔗
Next, you create a bearer token which will serve as an authorization token for the Dashboard. To that end, you will create two local files and “send” them to the cloud using the kubectl command. The first file is called dashboard-adminuser.yaml and its contents are
Use a text editor of your choice to create that file, on MacOS or Linux you can use nano, like this:
Install that file on the Kubernetes cluster with this command:
The second file to create is
and its contents should be:
apiVersion: rbac.authorization.k8s.io/v1
kind: ClusterRoleBinding
metadata:
  name: admin-user
roleRef:
  apiGroup: rbac.authorization.k8s.io
  kind: ClusterRole
  name: cluster-admin
subjects:
- kind: ServiceAccount
  name: admin-user
  namespace: kubernetes-dashboard
The command to send it to the cloud is
Step 3 Create secret for admin-user🔗
We have to manually create token for admin user.
Create file admin-user-token.yaml
Enter the following code:
apiVersion: v1
kind: Secret
metadata:
  name: admin-user-token
  namespace: kubernetes-dashboard
  annotations:
    kubernetes.io/service-account.name: "admin-user"
type: kubernetes.io/service-account-token
Execute it with
Step 4 Get the bearer token for authentication to dashboard🔗
The final step is to get the bearer token, which is a long string that will authenticate calls to Dashboard:
kubectl -n kubernetes-dashboard get secret admin-user-token -o jsonpath="{.data.token}" | base64 --decode
The bearer token string will be printed in terminal screen.
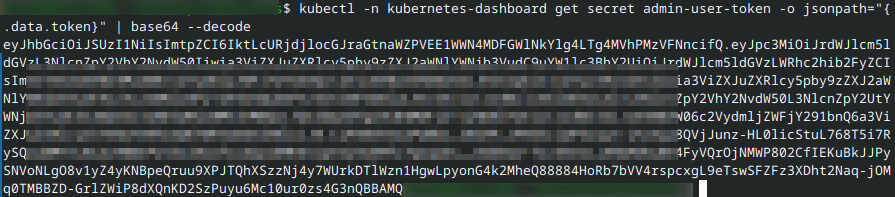
Copy it to a text editor, it will be needed after you access the Dashboard UI through a HTTPS call.
Note
If the last character of the bearer token string is %, it may be a character that denotes the end of the string but is not a part of it. If you copy the bearer string and it is not recognized, try copying it without this ending character %.
Step 5 Create a separate terminal window for proxy access🔗
We shall now use a proxy server for Kubernetes API server. The proxy server
- handles certificates automatically when accessing Kubernetes API,
- connects to API extensions or dashboards (like in this article),
- enables testing of API calls locally before automating them in scripts.
To enable the connection, start a separate terminal window and first set up the config command for that window:
Change that address to point to your own config file on your computer.
The next command in that new window is:
The server is activated on port 8001:

Step 6 See the dashboard in browser🔗
Then enter this address into the browser:
http://localhost:8001/api/v1/namespaces/kubernetes-dashboard/services/https:kubernetes-dashboard:/proxy/
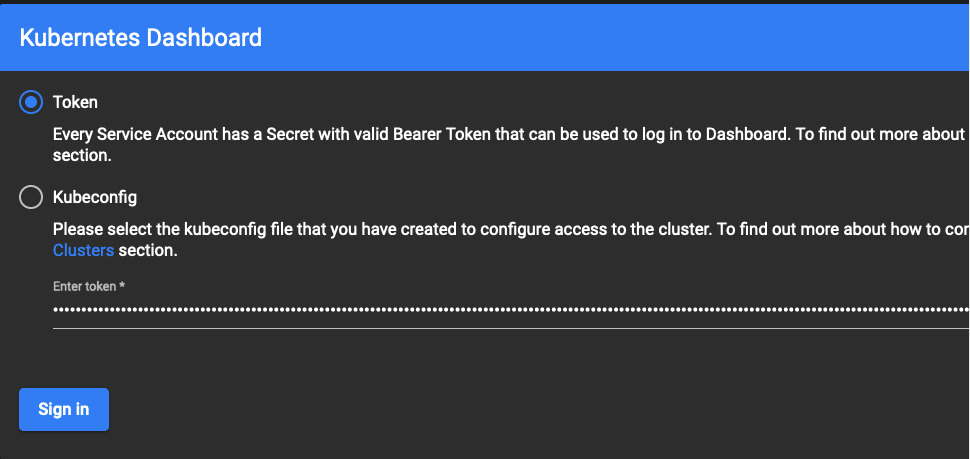
Enter the token, click on Sign In and get the Dashboard UI for the Kubernetes cluster.
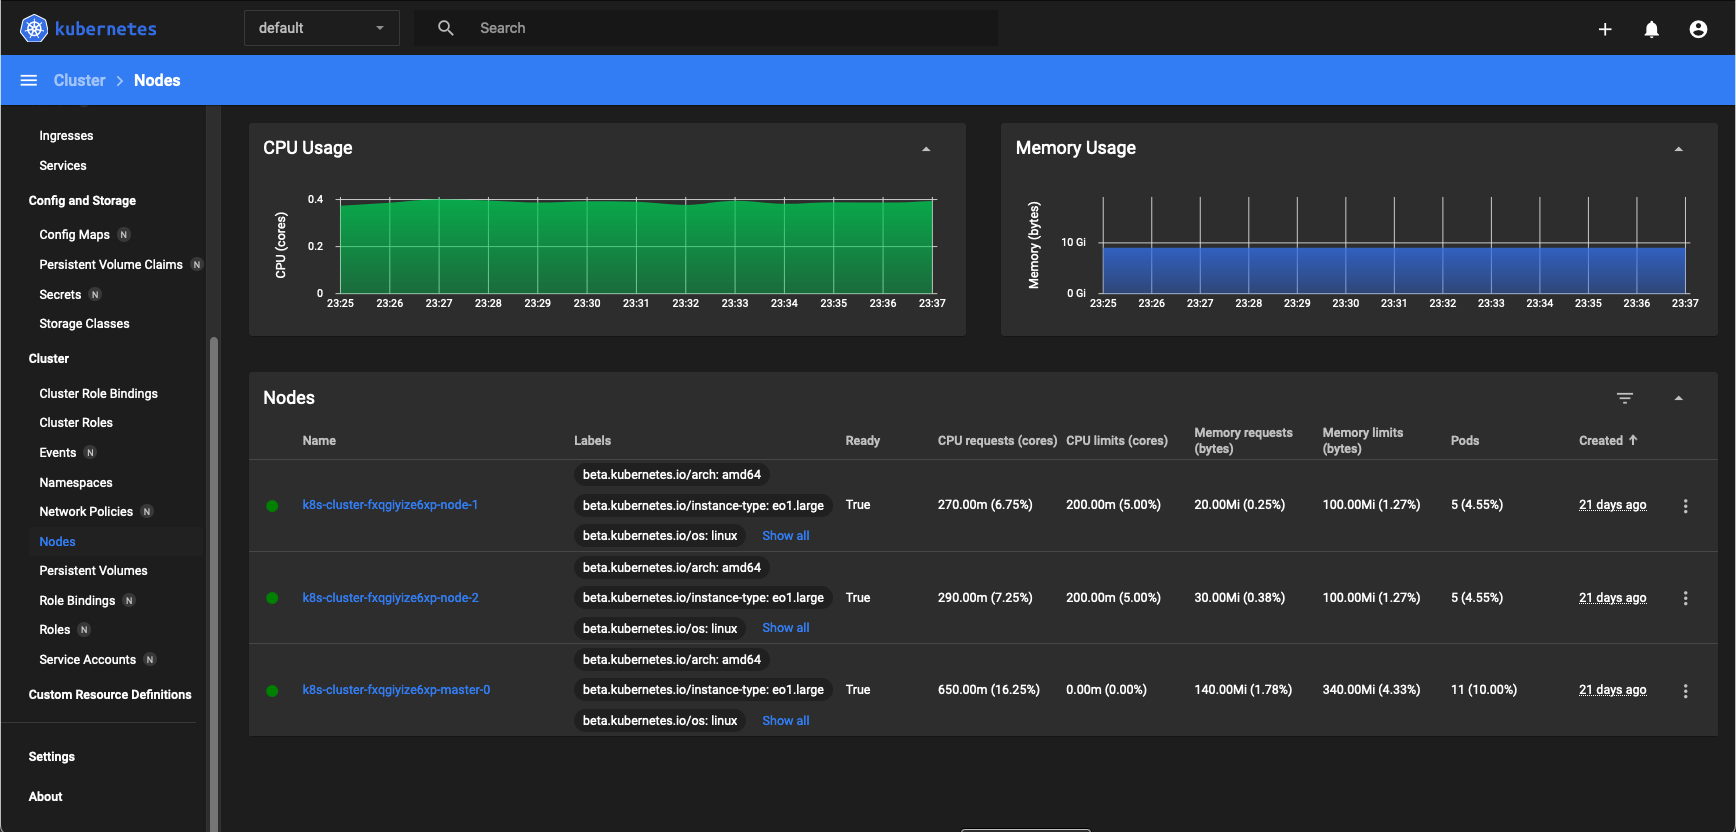
The Kubernetes Dashboard organizes working with the cluster in a visual and interactive way. For instance, click on Nodes on the left sides to see the nodes that the k8s-cluster has.
What To Do Next🔗
You can still use kubectl or alternate with using the Dashboard. Either way, you can
- deploy apps on the cluster,
- access multiple clusters,
- create load balancers,
- access applications in the cluster using port forwarding,
- use Service to access application in a cluster,
- list container images in the cluster
- use Services, Deployments and all other resources in a Kubernetes cluster.